Thursday, 15 September 2011

Resources....

This is one of my final posts so thought i should include some of the pages that i have used within my blogs and also some websites with some brilliant ideas for lesson planning


Free to register and well worth it!
It’s great to search for information and give some ideas of how to incorporate some concepts into lessons


I signed up a couple of months back and have received a few emails through with very helpful links to pages. 
The one below is brilliant; must have teacher tool kit! It has all sorts of lesson starters, ideas for activities etc


This website has some interesting case studies and ideas for activities within lessons


Quite an obvious resource but one not to be overlooked, lots of articles on all aspects of the environment and i found it extremely useful for weather and climate topics- also has GCSE bitesize revision!


Quite an unsuspecting resource but had a wealth of information with easy to understand explanations and diagrams all about weather and climate


Different year groups and all different topics of geography available here with lots of information and lesson ideas


I used this one quite a lot when i was completing the blog on weather and climate. Has some in depth tutorials that pupils could use themselves with additional information to build on basic knowledge


Loved this website! Found it really interesting and had lots of information about all sorts of topics within geography.


Saturday, 10 September 2011

Drought


Droughts are natural events. A drought happens when a period of low rainfall creates a shortage of water for people, the environment, agriculture, or industry. Some droughts are short and intense, for example, a hot, dry summer, while others are long and take some time to develop.


You can see from the map above the countries with the most common occurrences of drought over 30 years from 1974 – 2003. The main pattern is that the large majority of the drought regions lie in the southern hemisphere and in particular the Horn of Africa. In this part of Africa 12 million people are currently at risk of severe famine as 2 years of drought have pushed food prices through the roof. 

The article below has a very clear interactive map to the current humanitarian disaster in the Horn of Africa and has some truly scary statistics;


This post however is going to look into the recent drought currently underway in Texas, USA and the surrounding states. Texas has recorded its hottest summer in US history with many scorching days seeing temperatures over 110 °F. This record breaking summer has had many drastic consequences across the US and fears are that the drought could have global effects. The main cause of this drought is believed to be due to the 6th strongest La Nina year since 1949 causing a shift in the jet stream taking away moisture from the South.

What are the main consequences of this?

- Early estimates for crop and livestock losses are a staggering $5.2 billion, with the figure expected to rise as the drought continues
- Texas has lost a little over half of its cotton crop. As Texas produces 55% of the U.S. crop and two-thirds of America's export market cotton prices are surging due to the shrinking supplies.
-Catastrophic fires have been raging for months now due to the dry land and hot temperatures. The most recent have been classed as “worst fires on record” in Texas.

Bastrop Country fires


The Bastrop county fires began on the 4th September 2011 and continue to rage on. The fire now covers over 20,000 acres and is about 16 miles wide. A perilous mix of hot temperatures, strong winds and a historic drought has caused the Bastrop-area fire, the largest of the nearly 190 wildfires the state forest service says erupted this week, killing four people, destroying more than 1,700 homes and forcing thousands to evacuate.

Friday, 9 September 2011

La Nina/ El Nino

Both El Niño and La Niña are driven by water temperature and atmospheric conditions. These two are coupled: the warm oceanic phase, El Niño, accompanies high air surface pressure in the western Pacific, while the cold phase, La Nina, accompanies low air surface pressure in the western Pacific.Mechanisms that cause the oscillation remain under study.

La Nina

During La Niña years, the trade winds are unusually strong due to an enhanced pressure gradient between the eastern and western Pacific. As a result, upwelling is enhanced along the coast of South America, contributing to colder than normal surface waters over the eastern tropical Pacific and warmer than normal surface waters in the western tropical Pacific. This enhances normal levels of fish stocks as the upwelling of deep waters are nutrient rich.


El Nino
The trade winds do not replenish and sometimes even reverse direction to blow from west to east. This causes warm surface waters from the east to move eastward. Beneath the surface, the thermocline along the equator flattens as the warm waters at the surface effectively cap preventing the colder, deeper waters from upwelling. As a result, the large central and eastern Pacific regions warm up into an El Niño with waters warming by 3° to 5°F.


Below i have added a table that i created to summarise the difference between the two climatic conditions:


Below i have listed some websites with more information as i found it quite difficult to explain the two conditions:

This website has quite a lot of information with some interesting diagrams

I have used this website quite a bit during the blog as i always find the explanations interesting and easy to understand

NASA website also has some in depth explanations

Human impact – Case study 2- Are we running out of water?

The Planet Earth has a surface that is dominated by water, approximately 70% so why would be running out?


The problem
Although 70% of Earths surface is water only 2.5% of that is not salt water, and two-thirds of that is locked up in the icecaps and glaciers. Of what is left, about 20% is in remote areas, and much of the rest arrives at the wrong time and place, as monsoons and floods. Humans have available less than 0.08% of all the Earth's water. Yet over the next two decades our use is estimated to increase by about 40%.


This issue has to lead to some new discussions presented within the geography field including the term “peak water”. Ultimately, peak water is not about running out of fresh water, but about reaching physical, economic, and environmental limits on meeting human demands for water and the subsequent decline of water availability and use.


It is estimated that if the world continues at the same growth rate 1.8 billion people will be living with absolute “water scarcity” by 2025, and two thirds of the world population could be subject to “water stress”. These two terms refer to the demands of water exceeding available supplies.


Why has this problem occurred?

This has occurred from a combination of factors but the predominant factor has to be the global population boom over the last few decades. As populations grow, so too, do their demands on water. People must be fed, and agriculture must have water to grow crops and livestock. This puts a demand on naturally available water. Humans — via agriculture, industry and other demands - use about half of the world's renewable and accessible fresh water.


What are the consequences?

  • Lack of sanitation- Something that is already an issue isn't a lack of water, but a lack of clean water: Millions of people die each year from preventable diseases, after drinking water from an unsanitary source, this could be exacerbated
  • Famine- As water stress continues to increase there will be a struggle to continue food production at current rates with agriculture already consuming the majority of fresh water available mainly through irrigation techniques
  • Human conflict- It is known through historical records of past wars that water scarcity is a common cause for conflict. This could be a real issue in the future with an ever increasing global population
  • Drought- Reduced stream flow, river flow and shrinking lakes could lead to droughts. With many aquifers being over-pumped and are not recharging quickly enough this could be an issue.

Is this really occurring?

With many environmental issues springing up each year it is always important to employ speculation when looking at issues such as water stress/scarcity. From looking at many articles discussing water stress it is most definitely and issue and something that should be monitored. It does appear that this is another issue that may not become a real issue to the public until it has a direct impact on their lives

There are some easy quick fix solutions:
  1. Water conservation such as improving irrigation systems to reduce amount of water wasted
  2. Improved Water management including the use of technology for efficiency monitoring
  3. Improved crop knowledge by using less water intensive crops
What about this for a cool alternative.....


http://www.guardian.co.uk/science/2011/aug/30/firing-laser-beams-atmosphere-rain 

Wednesday, 7 September 2011

Case Study - UK Weather system

I have looked into air masses, fronts, depressions and also weather forecasting and now its the time to look at how all of the above affects the weather conditions experienced in the UK

Characteristics of the UK climate

The overall climate in England is called temperate maritime. This means that it is mild with temperatures not much lower than 0ºC in winter and not much higher than 32ºC in summer. It also means that it is damp and is subject to frequent changes.

Britain has four distinct seasons of fairly equal length - spring, summer, autumn and winter. In winter it is colder and wetter and the days are shorter than in summer. Along with 4 seasons in the UK there are also regional variations in climate. Generally the South is warmer than the north, the West and North West experience higher levels of precipitation and are also generally windier than the rest of the UK

So what causes the variations in climate?

You can see the image below shows the winds that each part of the UK experience and the general conditions this brings to the UK.


Above is a map showing the predominant air masses. Each of these have typical weather conditions:

Arctic Air (A):
  • Continental arctic (cA): Originating over the Arctic ocean in winter it brings extremely cold temperatures and very little moisture. 
  • Maritime arctic (mA): From the same source region, but less dry and less cold - in a way less extreme.
Polar Air (P):
  • Continental polar (cP): Originating from high latitudes this air mass often brings the cold, dry and clear weather in winter and also dry and warm weather in summer.
  • Maritime polar (mP): Originating as continental polar air over the North America Cool, when heated by the relatively warm water bodies this air mass becomes rather unstable resulting in blustery showers over the sea and windward coasts.
Tropical Air (T):
  • Continental tropical (cT): Originating from the arid and desert regions during summer. The least common air mass to affect the British weather however it can bring record heat to south-east Britain, particulary in late-summer.
  • Maritime tropical (mT).Originating from the Azores this brings mild and damp conditions in winter and warm and muggy conditions during summer. This air mass approaches the British Isles from the west, leading to overcast skies with prolonged rain for the western half of the country.

So we can see that the general climate in the UK and the variations experienced are largely influenced by the various air masses ranging from Arctic Maritime through to Tropical Continental.

Additional to the air masses other factors influence the British weather:

Continentality- This is the tendency of land to experience more thermal variation than water, due to the land's lower specific heat capacity. Continentality affects both temperature and precipitation across the UK

Prevailing wind- Britain's prevailing winds come from a south westerly direction over the Atlantic. The winds are cool in the summer and mild in the winter.

Gulf stream- Ocean currents can have a dramatic effect on a countries climate. In the UK, the Gulf stream has a very large impact on the weather experienced due to our close proximity to the Atlantic ocean.


The Gulf Stream is a warm ocean current in the North Atlantic flowing from the Gulf of Mexico, northeast along the U.S coast, and from there to the British Isles. The Gulf of Mexico has higher air temperatures than Britain as it's closer to the equator. This means that the air coming from the Gulf of Mexico to Britain is also warm. It is believed to warm the UK by 5-8 degrees Celsius.  However, the air is also quite moist as it travels over the Atlantic ocean. This is one reason why Britain often receives wet weather.

Classroom task

The past three posts have all focussed on air masses, fronts and the direct effect of them on UK weather. A nice summary of this would be a weather forecast presentation. It would be a group task to encourage the students to work together. They would pick a part of the UK and make a weather forecast up. It would include weather symbols, fronts and explanations behind all weather including causes for the conditions. There are a lot of resources available on websites for examples of forecasts.

Tuesday, 6 September 2011

Weather symbols and depressions

Following on from the last post i thought it would be good to add some information about weather symbols, typical forecasts and how to interpret them to understand weather systems. Additional to this, the post is going to touch upon depressions before leading in to the next post which will discuss The Great British Weather!

So below is an image listing all the relevant weather forecast symbols:


Included in the table above are symbols for fronts which were looked at in the last blog. Additional to this there are symbols for wind, cloud cover and additional conditions such as rain and fog. Although weather forecasts have changed visually over the last 30 years its still important to be able to understand the symbols and be aware of their definition. Below is just an idea of how they would normally be found together:


I have found a blank one of these which could be a quick 5 minute recap at the end of a lesson where students can fill in the blanks about each bit of the diagram

http://ww2010.atmos.uiuc.edu/guides/crclm/act/gifs/wx1.gif

Depressions

Its slightly mismatch to move from weather symbols into depressions but i wanted to add this in before i looked at Great British weather.
So what are they....

Depressions are areas of low atmospheric pressure which create unsettled weather conditions including clouds and rain. This is due to the fact that the air within the depression is rising, causing it to cool and the water vapour within it to condense into clouds. This rising air within a depression causes an area of low pressure at the surface. The deeper the depression the more unsettled the weather. Although conditions like precipitation are common for depressions the conditions are not uniform and can vary through the depression.

The page below has a brilliant explanation of how they form
http://www.bbc.co.uk/schools/gcsebitesize/geography/weather/weathersystemsrev3.shtml


Below is a good activity i have found from the TES website- http://www.tes.co.uk/teaching-resource/Depressions-3009177/

Depressions generally form over the Atlantic and move across to the UK. This weather system is the main influence on the weather experienced in the UK which the next post will be focus on.

Air masses and fronts

This post I am going to define both air masses and fronts, look into the classification and definitions of both. Following on from this I am going to do a case study of the UK weather system and what air masses affects Great Britain.


What is an air mass?

An Air mass is a large body of air defined by its properties of temperature, humidity and lapse rate. These are largely homogeneous over an area several hundred kilometres across. The nature of air masses is determined by three factors: the source region, the age and the modifications that may occur as they move away from their source region across the earth's surface. The nature of air masses change as they adopt the characteristics of the surface below

What are the classifications?

Air masses are classified primarily on the region the mass originated from and whether they originated over land or sea which demonstrates moisture content. They can be additionally categorised by the stability of the atmosphere below the air mass

Below are the common letters used to classify air masses:

Source region 
Arctic- A 
Polar – P 
Tropical Air – T 

Nature of the surface 
Continental - c 
Maritime – m 

Stability of the Atmosphere 
Air mass colder - k 
Air mass warmer - w 

Some common examples of typical wind patterns include:
  • Winds over warm land are called Tropical Continental - Tc
  • Winds over warm sea are called Tropical Maritime - Tm
  • Winds over cold land are called Polar Continental - Pc
  • Winds over cold sea are called Arctic Maritime - Pm or Am

When air masses meet...the boundary where air masses of different densities meet fronts form. Fronts are the dominant cause of meteorological changes and can be classed as warm, cold or occluded.


Warm fronts – Transition from cold air to warm air


A warm front is the transitional zone where a warm air mass is replacing a cold one. Warm fronts generally move from Southwest to Northeast and the air behind a warm front is warmer and moister than the air ahead of it. When a warm front passes through, the air becomes noticeably warmer and more humid than it was before.

Common characteristics include:
  1. Noticeable change in temperature in front of and behind a warm front
  2. Change in wind direction, most commonly winds ahead of the front  are typically from the east, but once the front passes through, winds usually shift around to the south-southwest
  3. Change in relative humidity as the air mass behind a warm front is commonly more moist that the air mass in front.
  4. Clouds and precipitation usually develop along and ahead of the warm front as warm moist air rides up and over the colder air ahead of it.


Cold front - Transition from warm air to cold air

A cold front is defined as the transition zone where a cold air mass is replacing a warmer air mass. Cold fronts generally move from Northwest to Southeast. The air behind a cold front is noticeably colder and drier than the air ahead of it.


Common characteristics include:
  1. Large change in temperature in front of and behind the front with warmer temperatures ahead.
  2. Change in wind direction is commonly observed, winds ahead of the front are typically out of the South-Southwest, but once the front passes through, winds usually shift around to the West-Northwest.
  3. Change in relative humidity with the air mass ahead of a cold front typically more moist than the air mass behind it.
  4. Clouds and precipitation form along and ahead of the cold front as the colder air mass lifts the warm moist air ahead of it.

Occluded front


A developing cyclone typically has a preceding warm front and a faster moving cold front. North of the warm front is a mass of cooler air that was in place before the storm even entered the region. As the storm intensifies, the cold front rotates around the storm and catches the warm front. This forms an occluded front, which is the boundary that separates the new cold air mass (to the west) from the older cool air mass already in place north of the warm front. Occluded fronts can occur as warm or cold occluded fronts and have similar characteristics to that of normal warm and cold fronts.

I have found this brilliant link on the TES site which is an interactive session discussing depressions, fronts and in particular the weather affecting Britain.

http://www.ngfl-cymru.org.uk/eng/vtc_-_ks4_-_geography_-_weather_and_climate_-_a_depression_and_its_associated_fronts

Next post im going to look into the weather symbols for fronts and other weather conditions then focus on depressions which are weather systems normally caused by cold fronts. Finally im going to end this section on a case study of the UK weather using all the information i have learnt from the two posts before hand.

Monday, 5 September 2011

Global Circulation- Polar Cell, Ferrel Cell and the associated wind patterns

Following on from the last post which I discussed the Hadley cell and global circulation within this post im going to touch upon the other two less well known cells the Polar cell and the Ferrell otherwise known as the Mid-latitude cell and also discuss the major wind patterns that exist on earth.

So how do we end up with such stunning scenery as this…


The Polar cell

This cell occurs at 60 degrees north and south. The air has been warmed up and rises upwards, creating a zone of low pressure. Though cool and dry relative to equatorial air, air masses are still sufficiently warm and moist to undergo convection. When the air reaches the polar areas, it has cooled considerably, and descends as a cold, dry high pressure area, moving away from the pole along the surface.The Hadley cell and the Polar cell are similar in that they exist as a direct consequence of surface temperatures. The outflow from the cell creates Rossby Waves, these are ultra-long waves which determine the path of the Jet Stream. By acting as a heat sink, the Polar cell also balances the Hadley cell in the Earth’s energy equation.

I think its worth adding in the diagram of the global circulation in just to recap...


The Ferrel cell 

The Ferrel cell occurs between 30 and 60 degrees north and south. The Ferrel cell is dependent for its existence upon the Hadley cell and the Polar cell. It comes about as a result of the the high and low pressure areas of the mid-latitudes. For this reason it is sometimes known as the "zone of mixing." In this cell at higher levels the wind blows equatorward and in a westerly direction and polewards and in an easterly direction on the surface. 

So that covers the three cell model for earths global circulation. Although it can be broken down into the three separate cells the majority of the time they can overlap and are certain wind patterns can override the common characteristics of the cells. 

If we move from the equator towards the poles we experience a number of different wind patterns. There are three main wind belts which occur as the coriolis force cause the flow to be deflected off the circulation cells. 


1) Trade winds (Easterlies): These are mainly associated with the Hadley cell. This wind pattern blows mainly North East in the Northern Hemisphere and South East in the Southern Hemisphere. The Trade winds occur across the equatorial region known as the Inter Tropical Convergence Zone (ITCZ) and when the two Hemisphere winds meet a low pressure area of calm winds form called Doldrums. The trade winds generally cause Cumulus clouds to form and when weaker during the Arctic Oscillation cause more rainfall across North America.


2) The Prevailing Westerlies: These are mainly associated with the Ferrel cell. They typically blow from the South West in the Northern Hemisphere and from the North west in the Southern Hemisphere. The Westerlies are strongest when the pressure at the poles are low and weakest when the pressure at the poles is high. They strongly influence the movement of the oceans playing an important role in moving warm waters and winds towards the western coastal regions of continents. When the Westerlies meet the trade winds the Horse latitudes occur which are characterized mainly by light, calm winds.


3) The Polar Easterlies: These are mainly associated with the polar cell. The dry cold prevailing winds blow from the north down to the Westerlies. The southerly flow of air towards the equator is because of the cold air subsiding at the poles. The polar easterlies are generally irregular and weak unlike the other wind patterns. When the Polar Easterlies converge with the westerlies the polar front occurs with similar weather conditions.


Finally as we have discussed the three main circulation cells, the three main wind belts and there are also some main pressure belts across earth:

They are:

1) Equatorial low – A region of low pressure associated with the rising air in the ITCZ. Warm air heated at the equator rises up into the atmosphere leaving a low pressure area underneath. As the air rises, clouds and rain form.
2) Subtropical high – A region of high pressure associated with sinking air in the horse latitudes. Air cools and descends in the subtropics creating areas of high pressure with associated clear skies and low rainfall. The descending air is warm and dry and deserts form in these regions.
3) Subpolar low – A region of low pressure associated with the polar front.
4) Polar high – A high pressure region associated with the cold, dense air of the polar regions.

Classroom tasks:

One task could be for students to draw there own global circulation model drawing on arrows representing wind patterns and include both the pressure bands and the cells. This also could be a good chance for students to present. They could pick one of the cells explaining in detail the patterns of wind and pressure associated with that cell 

Global Atmospheric Circulation- An Introduction

Atmospheric circulation is the large-scale movement of air by which heat is distributed on the surface of the Earth. Solar energy powers the atmospheric system and the energy circulations within it. The amount of solar energy (heat budget) received varies with latitude.  The tropics have an energy surplus as they gain more from insolation than is lost by radiation.  But the higher temperate and polar latitudes have an energy deficiency losing more by radiation than is gained by insolation

This disparity in the earth’s heat budget is counteracted by the ocean currents which accounts for 40% of the redistribution and atmospheric circulation accounting for 60% respectively.

This is achieved through three main convection cells:

1) Hadley Cell (Tropical Cell)
 
2) Ferrel Cell (Mid-latitude Cell)
3) Polar Cell

While the Hadley, Ferrel, and Polar cells are major players in global heat transport, they do not act alone. Disparities in temperature also drive a set of longitudinal circulation cells, and the overall atmospheric motion is known as the zonal overturning circulation.
 
As the Coriolis force runs across the 3 convection cells it causes the deflection of the wind creating some main patterns:

1) Easterlies
2) Doldrums
3) Westerlies
4) Horse Latitudes
5) Polar Easterlies
6) Polar front

This post is going to focus on the Hadley cell as this is said to have most impact on the atmospheric circulation.

The Hadley cell is a three dimensional atmospheric circulation cell located at roughly 0 to 30° North and South of the equator. Low latitude air moves towards the Equator and heats up.  As it heats it rises vertically and moves polewards in the upper atmosphere. This forms a convection cell that dominates tropical and sub-tropical climates.


As mentioned previously in this post near the poles, heat is lost to space by radiation exceeds the heat gained from sunlight, so air near the poles is losing heat. Conversely, heat gained from sunlight near the equator exceeds heat losses, so air near the equator is gaining heat. Air rises near the equator, flows north and south away from the equator at high altitudes, sinks near the poles, and flows back along the surface from both poles to the equator.

The combination of these two processes sets up a general circulation pattern: air rises near the equator, flows north and south away from the equator at high altitudes, sinks near the poles, and flows back along the surface from both poles to the equator. The video above just demonstrates the Hadley cell circulation in more detail and summaries all of the above.

http://www.youtube.com/watch?v=DHrapzHPCSA


Classroom task

I would like to do a summary of the Hadley cell circulation. I would like the students to chose how they would do this but the requirements would include at least 6 bullet points of how the circulation works. Other tasks could include true/false statements about the Hadley cell also getting in the diagram and filling in the stages of the circulation cell.

Next post will be explaining the other two cells; Polar and Ferrel in more detail and also beginning to explain the major wind patterns.

Hurricane Irene August 2011

Hurricane Irene

Although I have already covered Hurricanes I thought it was only appropriate to do a quick blog post on the recent Hurricane to hit the shores of the Carribean and the southern states of the USA. Despite it being much less destructive than anticipated, the scale of damage caused by Hurricane Irene was still substantial.

Just a short video footage of the hurricane...

http://www.youtube.com/watch?v=CdW8vdUm70M&feature=related

Characteristics of Irene:
  • The first notable Hurricane of the Atlantic season
  • Formed on 20th August and raged across the Caribbean, USA and up through Canada until dissipating on the 29th August
  • Highest winds recorded were 120mph and at its largest had a diameter of over    500  miles!
  • At its peak Irene was a Category 3 Hurricane


Below is an image of the path Hurricane Irene took over the 9 days it was present over the Atlantic area. The image also shows when it was at its most dangerous using the Saffir- Simpson scale


3 p’s
Something I still remember from studying weather is the 3 p’s associated with natural disasters. They can vary by definition but im choosing Prediction, Prevention and Preparation. This is something that this article will focus on and will show how implementing the 3 p’s successfully can drastically reduce damage.


Prediction

The majority of this is done by the monitoring of Satellites and local weather conditions to determine the path the Hurricane is likely to take. By predicting this prevention methods can be put in place. Weather stations are constantly monitoring weather conditions so can issue warnings in advance to whether a tropical cyclone is likely to be upgraded to a Hurricane

Prevention

This particular category is hard to apply to Hurricanes as in the simplest of terms they are impossible to prevent. However, prevention can be applied in other ways including prevention of damage to housing, infrastructures and loss of human life. This is where Preparation is key as by putting solid methods in place prior to the Hurricane reaching shore the damage can be drastically reduced.


Preparation

Below are just some of the methods the USA had in place prior to the Hurricane reaching major cities such as New York:

  • Severe Weather warnings in place across 8 states
  • 2 million people ordered to evacuate including 300,000 people living in low lying areas of New York
  • 90 shelters set up in New York for over 70,000 people
  • Entire shutdown of New Yorks transit system including the subway, rail travel and bus travel
  • 200 trucks of emergency supplies and 100,000 national guards on stand by 

What was the damage from the Hurricane? 
  • 55 fatalaties caused by Hurricane Irene
  • Total damage caused is approximately $10 Billion
  • Extensive flooding across New york and Vermont


Conclusion

Although I haven’t covered any new concepts in this post it is always interesting to see how natural occurring events such as Hurricanes affect humans and how despite our technological advances we can’t overcome human nature. Despite this it is clear to see how our technology has allowed huge advances in predicting paths hurricanes may take and through this enabling preparations to be put in place such as mass evacuations and protections of infrastructure.

Finally, with the Atlantic Hurricane season only just beginning i think we can be fairly certain that more damage from Hurricanes will be felt over the coming months

Have a quick look at the below article which gives an interesting read....

Friday, 26 August 2011

Measuring and Analysis of Climate- Some examples

Weather Balloons:
Weather balloons were first used over a century ago and were used to establish the presence of the stratosphere and tropopause. This equipment consists of a latex balloon, a parachute and a radiosonde which hangs below.

Similarly to the weather station, the radiosonde measures temperature with a thermometer, humidity with hygrometer and air pressure with a barometer, taking continuous measurements as the balloon rises. The equipment includes a tracking device which monitors the movement and converts wind speed and wind direction. An example of a weather balloon which climbed to 93,000 feet can be viewed here;

http://www.youtube.com/watch?v=dRZJdJ-HZY8.  

Satellites:
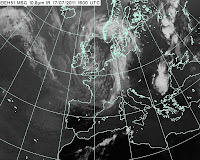
Infra-red satellite images play a large part in determining global weather patterns and revolutionized meteorology (the study of weather) in 1960 when the first image returned to earth. The image below shows infra-red radiation over the UK. This is emitted by both clouds and the earth’s surface and gives an accurate reading of temperature. This is found using a grey scale with lighter areas of cloud indicating where the cloud tops are cooler and therefore where weather features like fronts and shower clouds are.

This has come on a long way since the first satellite image, taken in 1960. This was the beginning of the highly accurate reports produced in the modern day.

Analyses:
The data provided by weather stations, buoys, balloons and satellite imagery are all compiled into highly complex mathematical computer models. The outputs of these are the weather forecasts which are produced and shown in the media every day.
A weather forecast is produced by translating physical laws which govern weather into mathematical equations. These equations form a 3D ‘dynamical model’, an example of which can be seen below (depicting Hurricane Floyd). The information which can be input into these equations is found using the measurement methods mentioned before.

These computer models forecast how the atmosphere is most likely to react over a period of time but are constrained by technology. For example certain variables may not be considered if they aren’t input. The forecast at this stage then needs to be translated into a more universal forecast using Model Output Statistics (MOS) equations. These are calculations which look at past model outputs and actual weather. By including actual weather this helps to provide a more accurate and localised forecast. A human forecaster will calculate the MOS equations and make a comparison with the computer model. This can then be used to make an accurate expectation of the weather.

Thursday, 25 August 2011

Measuring and Analysis of climate

Moaning about the weather....very British but how easy is it to put together a weather forecast and is it done in modern times as it was done in the past. I have looked into the factors that need to be considered when discussing the climate and some ways climate is measured.
To measure climate accurately 7 factors need to be considered. These are:
·         Temperature and precipitation – varying temperature is arguably the most direct indication of changes within the atmosphere.
·         Pressure – similarly to temperature this is an indication of atmospheric conditions.
·         Biomass – this is analysed by monitoring flora and fauna over longer periods of time and identifying differences in species and mass.
·         Sea level – changes in sea level can indicate variations in ocean salinity, a factor known to both be greatly affected by climate and to greatly affect climate.
·         Solar activity – influences climate through varying solar radiation.
·         Volcanic eruptions – alter climate patterns locally by aerosol emissions.
·         Chemical composition – research indicates a strong correlation between certain gasses (e.g. CO2 and CH4) and temperature.
In the past measuring climate focused on air pressure, temperature, precipitation. This relied on comparatively simple technology such as the pressure gauge, thermometer or rain gauge. In the modern day, measurement and analyses of weather is primarily carried out using a combination of weather balloons, satellites and local weather stations.
Local weather stations:
Weather stations are able to measure several of the variables mentioned above using incredibly precise equipment. A weather station will typically be located in open areas where the human impact on surrounding environment is limited. Weather stations aren’t limited to set points on land but also come in the form of ships and buoys which can monitor conditions at sea.
Weather stations tend to have vast amounts of equipment to monitor wind speed, humidity and temperature which are measured with varying instruments.
Wind speed: most weather stations will be equipped with a highly accurate weather vane to indicate wind directions as well as an anemometer.  The anemometer indicates wind speed and is composed of small cups which are caught in the wind causing the device to spin at a speed. This spinning is then translated into a wind speed, commonly expressed in Mph.
Humidity: this is measured using a hygrometer. Arguably the most accurate type is the chilled mirror hygrometer which measures the temperature of a mirror at the point that a drop of moisture begins to condense. This gives name to the dew point.
Temperature:  the majority of weather stations are equipped with a ‘Stevenson screen’ which ensures the measurement of temperature (via a thermometer installed internally) isn’t affected by solar irradiation.

 The slats on the side allow air to circulate and ensure an accurate temperature reading. Two thermometers are placed inside, one of which is constantly wet. This can be used to indicate evaporation and (therefore humidity) in a similar fashion to the hygrometer.   
Next post- I will be adding some more examples of measuring climate and providing some form of analysis on the different methods chosen to monitor climate

Tuesday, 16 August 2011

Atmospheric Lapse Rates

What does it mean?

The atmospheric lapse rate describes the reduction, or lapse of air temperature that takes place with increasing altitude. Lapse rates related to changes in altitude can also be developed for other properties of the atmosphere.
There are three types of lapse rates, Dry Adiabatic, Saturated Adiabatic and Environmental Lapse rates.

If a material changes its physical state (that is, if its pressure, volume, or temperature change) without any heat being either added to it or withdrawn from it, the change is said to be adiabatic. So, an Environmental Lapse rates refers to a change in a physical state with heat added.

What affect do Lapse rates have on the environment?

The average atmospheric lapse rate results in a temperature decrease of 3.5°F (1.94°C) per 1,000 feet (304 m) of altitude.

There are two types of lapse rates, Dry Adiabatic and Saturated Adiabatic both of which have varying temperature changes, so what are they?

Dry Adiabatic - A dry, not saturated parcel of air, has a dry adiabatic lapse rate of 1°C/100m
Saturated Adiabatic - This saturated parcel of air has a saturated adiabatic lapse rate of 0.6°C/100 m


From the atmospheric lapse rates you can tell whether the atmosphere is stable or unstable. This can be seen when the actual lapse rate is either greater or less than the dry adiabatic lapse rate. This variation from the dry adiabatic lapse rate is what determines whether the air is stable or unstable.

The vertical air temperature distribution in the atmosphere is highly variable. For dry air it ranges as follows:
  1. Very stable : Temperature increases with increase in altitude. This is a "plus" temperature lapse rate, or an inversion.
  2. Stable : Temperature lapse rate is less than the dry adiabatic rate, but temperature decreases with altitude increase.
  3. Neutral : Temperature lapse rate is the same as the dry adiabatic rate of 5.5 degrees Fahrenheit per 1000 feet increase.
  4. Unstable : Temperature lapse rate is greater than the dry adiabatic rate. It may be 6 degrees Fahrenheit or more.
  5. Very unstable : Temperature lapse rate is much greater than the dry adiabatic rate, and is called super-adiabatic.

Classroom tasks:

Some tasks could include picking key words and asking for explanations. I would want students to know the main difference between lapse rates and also explain each condition for the stability of the atmosphere.

Although this isnt the best example, there could be a graph plotting exercise showing lapse rates and temperatures:

http://www.mhartman-wx.com/fcst_tools/lapse_rates.html

Tuesday, 2 August 2011

Human Impact- Case Study 1 - The Great Pacific Garbage Patch

Each year, three times as much rubbish is dumped into the world's oceans as the weight of fish caught.

So what is the Great Pacific Garbage Patch...


It is a gyre of Marine litter twice the size of France situated off the coast of California that is estimated to contain 100 million tonnes of waste, predominantly plastic. In 2009 the ocean was said to have 46,000 pieces of plastic per squre kilometre of ocean which out weighs the amount of Plankton by the ratio 6:1.The great Pacific patch is the largest landfill site in the world although there are other Garbage patches, most notably in the North Atlantic and the Indian Ocean.

How did it get there?

The plastic has travelled far and wide down streams and rivers finally entering the ocean where the waste accumuates into one large landfill site. Additional to land pollution of plastic, other sources include commercial fishing, recreational boaters, merchant military vessells and offshore oil and gas platforms.


What are the main affects on the environment?

The largest effect of the garbage patches in the ocean is to the marine life. Although it is widely accepted that plastic itself is not toxic, it attracts and allows other harmful chemicals to accumulate such as PCB and DDT. These chemicals in high levels are dangerous to most species of animals.

"Worldwide, according to the United Nations Environment Programme, plastic is killing a million seabirds a year, and 100,000 marine mammals and turtles."


Although chemical pollutants are dangerous the main cause of death is entanglement in the plastic waste or swallowing and thus choking on plastic particles. The larger pieces of plastic can cause the entanglement however it is the smaller pieces which can be swallowed. Plastic is not biodegradable however, it can be photodegraded. This breaks down larger pieces of plastic in smaller particles which then remain in the ocean.

What can be done to help?

There are many ongoing relief efforts which are aimed at recovering large amounts of plastic from the oceans. There are also quite a few charities which are commited to helping clean up the garbage patches.

One charity which appears quite influential from the research i have carried out is http://www.5gyres.org/
The main mission of the charity is outlined below:

"To conduct research and communicate about the global impact of plastic pollution in the world’s oceans and employ strategies to eliminate the accumulation of plastic pollution in the 5 subtropical gyres."

This is just a small example of how humans can impact the environment on a grand scale with the consequences of human actions irrevocable.  Although this does stray away from the topic of weather slightly i do think its important to look at this topic in broad terms.

Classroom tasks
This is a difficult issue to tackle with the human race so accustomed to using plastic as the predominant packaging material. One task could students working together in groups to think of ways the "garbage patch" phenomena can be avoided in the future and also how best to tackle the current issue of waste in the oceans.

Another question to pose could be whether they think its acceptable to use to oceans in such a way. This could be a good linking question as can be made relevent to alot of geographical concepts such as space, place and population  

Wednesday, 27 July 2011

Ocean currents

A Current is the motion of water. The currents in the ocean can be divided into two main types. The upper km of the ocean is governed by the wind whereas the deeper parts of the ocean are affected by mixing of deeper currents to create water with varying density.

Surface currents:

They make up 10% of all the oceans water and is controlled by the wind. The surface currents are dominated by Gyres. So what are Gyres.....


Gyres are, in the simplest of terms, a large system of rotating ocean currents. They are caused by the wind blowing on the water pushing it in a direction. When the coriolis force pushes against the wind direction gyres form from this rotational pattern.

There are 5 major Gyres:

Indian Ocean Gyre
North Atlantic Gyre
North Pacific Gyre
South Atlantic Gyre
South Pacific Gyre

All of the major gyres can be seen in the map above. A lot of the research i have done on this topic has unearthed a large quantity of environmental studies in ocean pollution. The predominat topic are the major garbage patches which have formed in the oceans, this will be covered in my next blog post.


Deep Ocean currents:

These ocean currents make up 90% of the oceans water and mainly determined by water density.


The Thermohaline Circulation

This is a density driven current which involves an overturning of water to create different density pockets with varying temperaratures. This circulation moves warm water polewards where it is then converted into cold water which sinks and flows down towards the equator.

The two main interconnected processes are:

1) Deep convection
2) Upwelling through the rest of the ocean to bring the cold water back to the surface

Why is the conveyor belt so important?

The Thermohaline circulation has a major impact on the global climate. The circulation is the main supplier of heat to the polar regions and thus controls the levels of ice in this area. This is so vital as any slight changes in global temperatures are known to have a dramatic effect on sea levels rising due to melting areas of ice.

Although it is not known for certain the level the THC affects global climate, it is believed to affect the radiation budget and alongside this largely influence levels of carbon dioxide in the atmosphere.

This falls into the climate change category which i will focus on in some of my later blogs. I will look specifically at how changes in climate effect certain weather patterns such as Hurricanes and Ocean currents.

Tasks for the classroom:

This was a difficult one as although i find the oceans quite enthralling due to the vast size of them and their influence on the world trying to find exciting tasks which will enhance learning has not been easy. As my next topic about the oceans is about the shutdown of the THC i might set them a task to research the effects of this might be on the world.

Random facts:

- 90% of all volcanic activity occurs in the oceans.
- The speed of sound in water is 1,435 m/sec - nearly five times faster than the speed of sound in air.
- Less than 10% of our oceans have been explored by humans
- Mt Everest is more than 1 mile shorter than the deepest part of the ocean. Challenger Deep is 6.86 miles deep.