Friday 26 August 2011

Measuring and Analysis of Climate- Some examples

Weather Balloons:
Weather balloons were first used over a century ago and were used to establish the presence of the stratosphere and tropopause. This equipment consists of a latex balloon, a parachute and a radiosonde which hangs below.

Similarly to the weather station, the radiosonde measures temperature with a thermometer, humidity with hygrometer and air pressure with a barometer, taking continuous measurements as the balloon rises. The equipment includes a tracking device which monitors the movement and converts wind speed and wind direction. An example of a weather balloon which climbed to 93,000 feet can be viewed here;

http://www.youtube.com/watch?v=dRZJdJ-HZY8.  

Satellites:
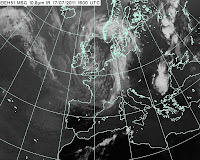
Infra-red satellite images play a large part in determining global weather patterns and revolutionized meteorology (the study of weather) in 1960 when the first image returned to earth. The image below shows infra-red radiation over the UK. This is emitted by both clouds and the earth’s surface and gives an accurate reading of temperature. This is found using a grey scale with lighter areas of cloud indicating where the cloud tops are cooler and therefore where weather features like fronts and shower clouds are.

This has come on a long way since the first satellite image, taken in 1960. This was the beginning of the highly accurate reports produced in the modern day.

Analyses:
The data provided by weather stations, buoys, balloons and satellite imagery are all compiled into highly complex mathematical computer models. The outputs of these are the weather forecasts which are produced and shown in the media every day.
A weather forecast is produced by translating physical laws which govern weather into mathematical equations. These equations form a 3D ‘dynamical model’, an example of which can be seen below (depicting Hurricane Floyd). The information which can be input into these equations is found using the measurement methods mentioned before.

These computer models forecast how the atmosphere is most likely to react over a period of time but are constrained by technology. For example certain variables may not be considered if they aren’t input. The forecast at this stage then needs to be translated into a more universal forecast using Model Output Statistics (MOS) equations. These are calculations which look at past model outputs and actual weather. By including actual weather this helps to provide a more accurate and localised forecast. A human forecaster will calculate the MOS equations and make a comparison with the computer model. This can then be used to make an accurate expectation of the weather.

Thursday 25 August 2011

Measuring and Analysis of climate

Moaning about the weather....very British but how easy is it to put together a weather forecast and is it done in modern times as it was done in the past. I have looked into the factors that need to be considered when discussing the climate and some ways climate is measured.
To measure climate accurately 7 factors need to be considered. These are:
·         Temperature and precipitation – varying temperature is arguably the most direct indication of changes within the atmosphere.
·         Pressure – similarly to temperature this is an indication of atmospheric conditions.
·         Biomass – this is analysed by monitoring flora and fauna over longer periods of time and identifying differences in species and mass.
·         Sea level – changes in sea level can indicate variations in ocean salinity, a factor known to both be greatly affected by climate and to greatly affect climate.
·         Solar activity – influences climate through varying solar radiation.
·         Volcanic eruptions – alter climate patterns locally by aerosol emissions.
·         Chemical composition – research indicates a strong correlation between certain gasses (e.g. CO2 and CH4) and temperature.
In the past measuring climate focused on air pressure, temperature, precipitation. This relied on comparatively simple technology such as the pressure gauge, thermometer or rain gauge. In the modern day, measurement and analyses of weather is primarily carried out using a combination of weather balloons, satellites and local weather stations.
Local weather stations:
Weather stations are able to measure several of the variables mentioned above using incredibly precise equipment. A weather station will typically be located in open areas where the human impact on surrounding environment is limited. Weather stations aren’t limited to set points on land but also come in the form of ships and buoys which can monitor conditions at sea.
Weather stations tend to have vast amounts of equipment to monitor wind speed, humidity and temperature which are measured with varying instruments.
Wind speed: most weather stations will be equipped with a highly accurate weather vane to indicate wind directions as well as an anemometer.  The anemometer indicates wind speed and is composed of small cups which are caught in the wind causing the device to spin at a speed. This spinning is then translated into a wind speed, commonly expressed in Mph.
Humidity: this is measured using a hygrometer. Arguably the most accurate type is the chilled mirror hygrometer which measures the temperature of a mirror at the point that a drop of moisture begins to condense. This gives name to the dew point.
Temperature:  the majority of weather stations are equipped with a ‘Stevenson screen’ which ensures the measurement of temperature (via a thermometer installed internally) isn’t affected by solar irradiation.

 The slats on the side allow air to circulate and ensure an accurate temperature reading. Two thermometers are placed inside, one of which is constantly wet. This can be used to indicate evaporation and (therefore humidity) in a similar fashion to the hygrometer.   
Next post- I will be adding some more examples of measuring climate and providing some form of analysis on the different methods chosen to monitor climate

Tuesday 16 August 2011

Atmospheric Lapse Rates

What does it mean?

The atmospheric lapse rate describes the reduction, or lapse of air temperature that takes place with increasing altitude. Lapse rates related to changes in altitude can also be developed for other properties of the atmosphere.
There are three types of lapse rates, Dry Adiabatic, Saturated Adiabatic and Environmental Lapse rates.

If a material changes its physical state (that is, if its pressure, volume, or temperature change) without any heat being either added to it or withdrawn from it, the change is said to be adiabatic. So, an Environmental Lapse rates refers to a change in a physical state with heat added.

What affect do Lapse rates have on the environment?

The average atmospheric lapse rate results in a temperature decrease of 3.5°F (1.94°C) per 1,000 feet (304 m) of altitude.

There are two types of lapse rates, Dry Adiabatic and Saturated Adiabatic both of which have varying temperature changes, so what are they?

Dry Adiabatic - A dry, not saturated parcel of air, has a dry adiabatic lapse rate of 1°C/100m
Saturated Adiabatic - This saturated parcel of air has a saturated adiabatic lapse rate of 0.6°C/100 m


From the atmospheric lapse rates you can tell whether the atmosphere is stable or unstable. This can be seen when the actual lapse rate is either greater or less than the dry adiabatic lapse rate. This variation from the dry adiabatic lapse rate is what determines whether the air is stable or unstable.

The vertical air temperature distribution in the atmosphere is highly variable. For dry air it ranges as follows:
  1. Very stable : Temperature increases with increase in altitude. This is a "plus" temperature lapse rate, or an inversion.
  2. Stable : Temperature lapse rate is less than the dry adiabatic rate, but temperature decreases with altitude increase.
  3. Neutral : Temperature lapse rate is the same as the dry adiabatic rate of 5.5 degrees Fahrenheit per 1000 feet increase.
  4. Unstable : Temperature lapse rate is greater than the dry adiabatic rate. It may be 6 degrees Fahrenheit or more.
  5. Very unstable : Temperature lapse rate is much greater than the dry adiabatic rate, and is called super-adiabatic.

Classroom tasks:

Some tasks could include picking key words and asking for explanations. I would want students to know the main difference between lapse rates and also explain each condition for the stability of the atmosphere.

Although this isnt the best example, there could be a graph plotting exercise showing lapse rates and temperatures:

http://www.mhartman-wx.com/fcst_tools/lapse_rates.html

Tuesday 2 August 2011

Human Impact- Case Study 1 - The Great Pacific Garbage Patch

Each year, three times as much rubbish is dumped into the world's oceans as the weight of fish caught.

So what is the Great Pacific Garbage Patch...


It is a gyre of Marine litter twice the size of France situated off the coast of California that is estimated to contain 100 million tonnes of waste, predominantly plastic. In 2009 the ocean was said to have 46,000 pieces of plastic per squre kilometre of ocean which out weighs the amount of Plankton by the ratio 6:1.The great Pacific patch is the largest landfill site in the world although there are other Garbage patches, most notably in the North Atlantic and the Indian Ocean.

How did it get there?

The plastic has travelled far and wide down streams and rivers finally entering the ocean where the waste accumuates into one large landfill site. Additional to land pollution of plastic, other sources include commercial fishing, recreational boaters, merchant military vessells and offshore oil and gas platforms.


What are the main affects on the environment?

The largest effect of the garbage patches in the ocean is to the marine life. Although it is widely accepted that plastic itself is not toxic, it attracts and allows other harmful chemicals to accumulate such as PCB and DDT. These chemicals in high levels are dangerous to most species of animals.

"Worldwide, according to the United Nations Environment Programme, plastic is killing a million seabirds a year, and 100,000 marine mammals and turtles."


Although chemical pollutants are dangerous the main cause of death is entanglement in the plastic waste or swallowing and thus choking on plastic particles. The larger pieces of plastic can cause the entanglement however it is the smaller pieces which can be swallowed. Plastic is not biodegradable however, it can be photodegraded. This breaks down larger pieces of plastic in smaller particles which then remain in the ocean.

What can be done to help?

There are many ongoing relief efforts which are aimed at recovering large amounts of plastic from the oceans. There are also quite a few charities which are commited to helping clean up the garbage patches.

One charity which appears quite influential from the research i have carried out is http://www.5gyres.org/
The main mission of the charity is outlined below:

"To conduct research and communicate about the global impact of plastic pollution in the world’s oceans and employ strategies to eliminate the accumulation of plastic pollution in the 5 subtropical gyres."

This is just a small example of how humans can impact the environment on a grand scale with the consequences of human actions irrevocable.  Although this does stray away from the topic of weather slightly i do think its important to look at this topic in broad terms.

Classroom tasks
This is a difficult issue to tackle with the human race so accustomed to using plastic as the predominant packaging material. One task could students working together in groups to think of ways the "garbage patch" phenomena can be avoided in the future and also how best to tackle the current issue of waste in the oceans.

Another question to pose could be whether they think its acceptable to use to oceans in such a way. This could be a good linking question as can be made relevent to alot of geographical concepts such as space, place and population